
A discount test can lift orders by 10% and still cost you revenue. Your dashboard might call it a win but finance won’t.
If you’ve been running a programme for a while, that gap deserves a closer look. Each test you’ve shipped improved one part of the site but are those wins adding up to stronger commercial results?
Ecommerce conversion rate optimisation, or CRO for short, should help you earn more from the traffic you already have. Once you’re running a programme, that means looking hard at how you judge a winning test, and whether the tactics you’ve shipped still earn their place with the people who see them.
The difficult decision is where to invest next. Is there unresolved friction? Have your hypotheses become too narrow? Or are your tactics reaching people who don’t need them?
What is ecommerce CRO?
Ecommerce CRO is the practice of increasing the share of website visitors who buy. You find what stops shoppers buying, remove it and test changes to prove what works. The goal is more revenue from the traffic you already have, and conversion rate is one input to that.
CRO and SEO do different jobs. SEO brings visitors to your site from search, and CRO improves what happens once they arrive.
The target you set decides what counts as a win. If your goal is more completed purchases, a discount that increases orders looks successful. If the goal is profitable revenue, you also need to show that those extra orders earn enough to cover the cost of the discount.
For a team that already runs a programme, the harder question is how much additional value your work creates, and how confidently you can show it.
Conversion rate and revenue per visitor
Conversion rate tells you how often a session ends in an order:
Conversion rate = orders ÷ sessions × 100
That gives you the purchase rate, but not what those purchases are worth. Revenue per visitor (RPV) brings in average order value:
RPV = revenue ÷ sessions, or conversion rate as a decimal × average order value
To see it in practice, a 2% conversion rate and a £100 average order value produce an RPV of £2.
Despite the name, most teams calculate RPV per session, which is what we do here. Some divide by users instead. Either works, as long as you state the denominator and never compare one with the other.
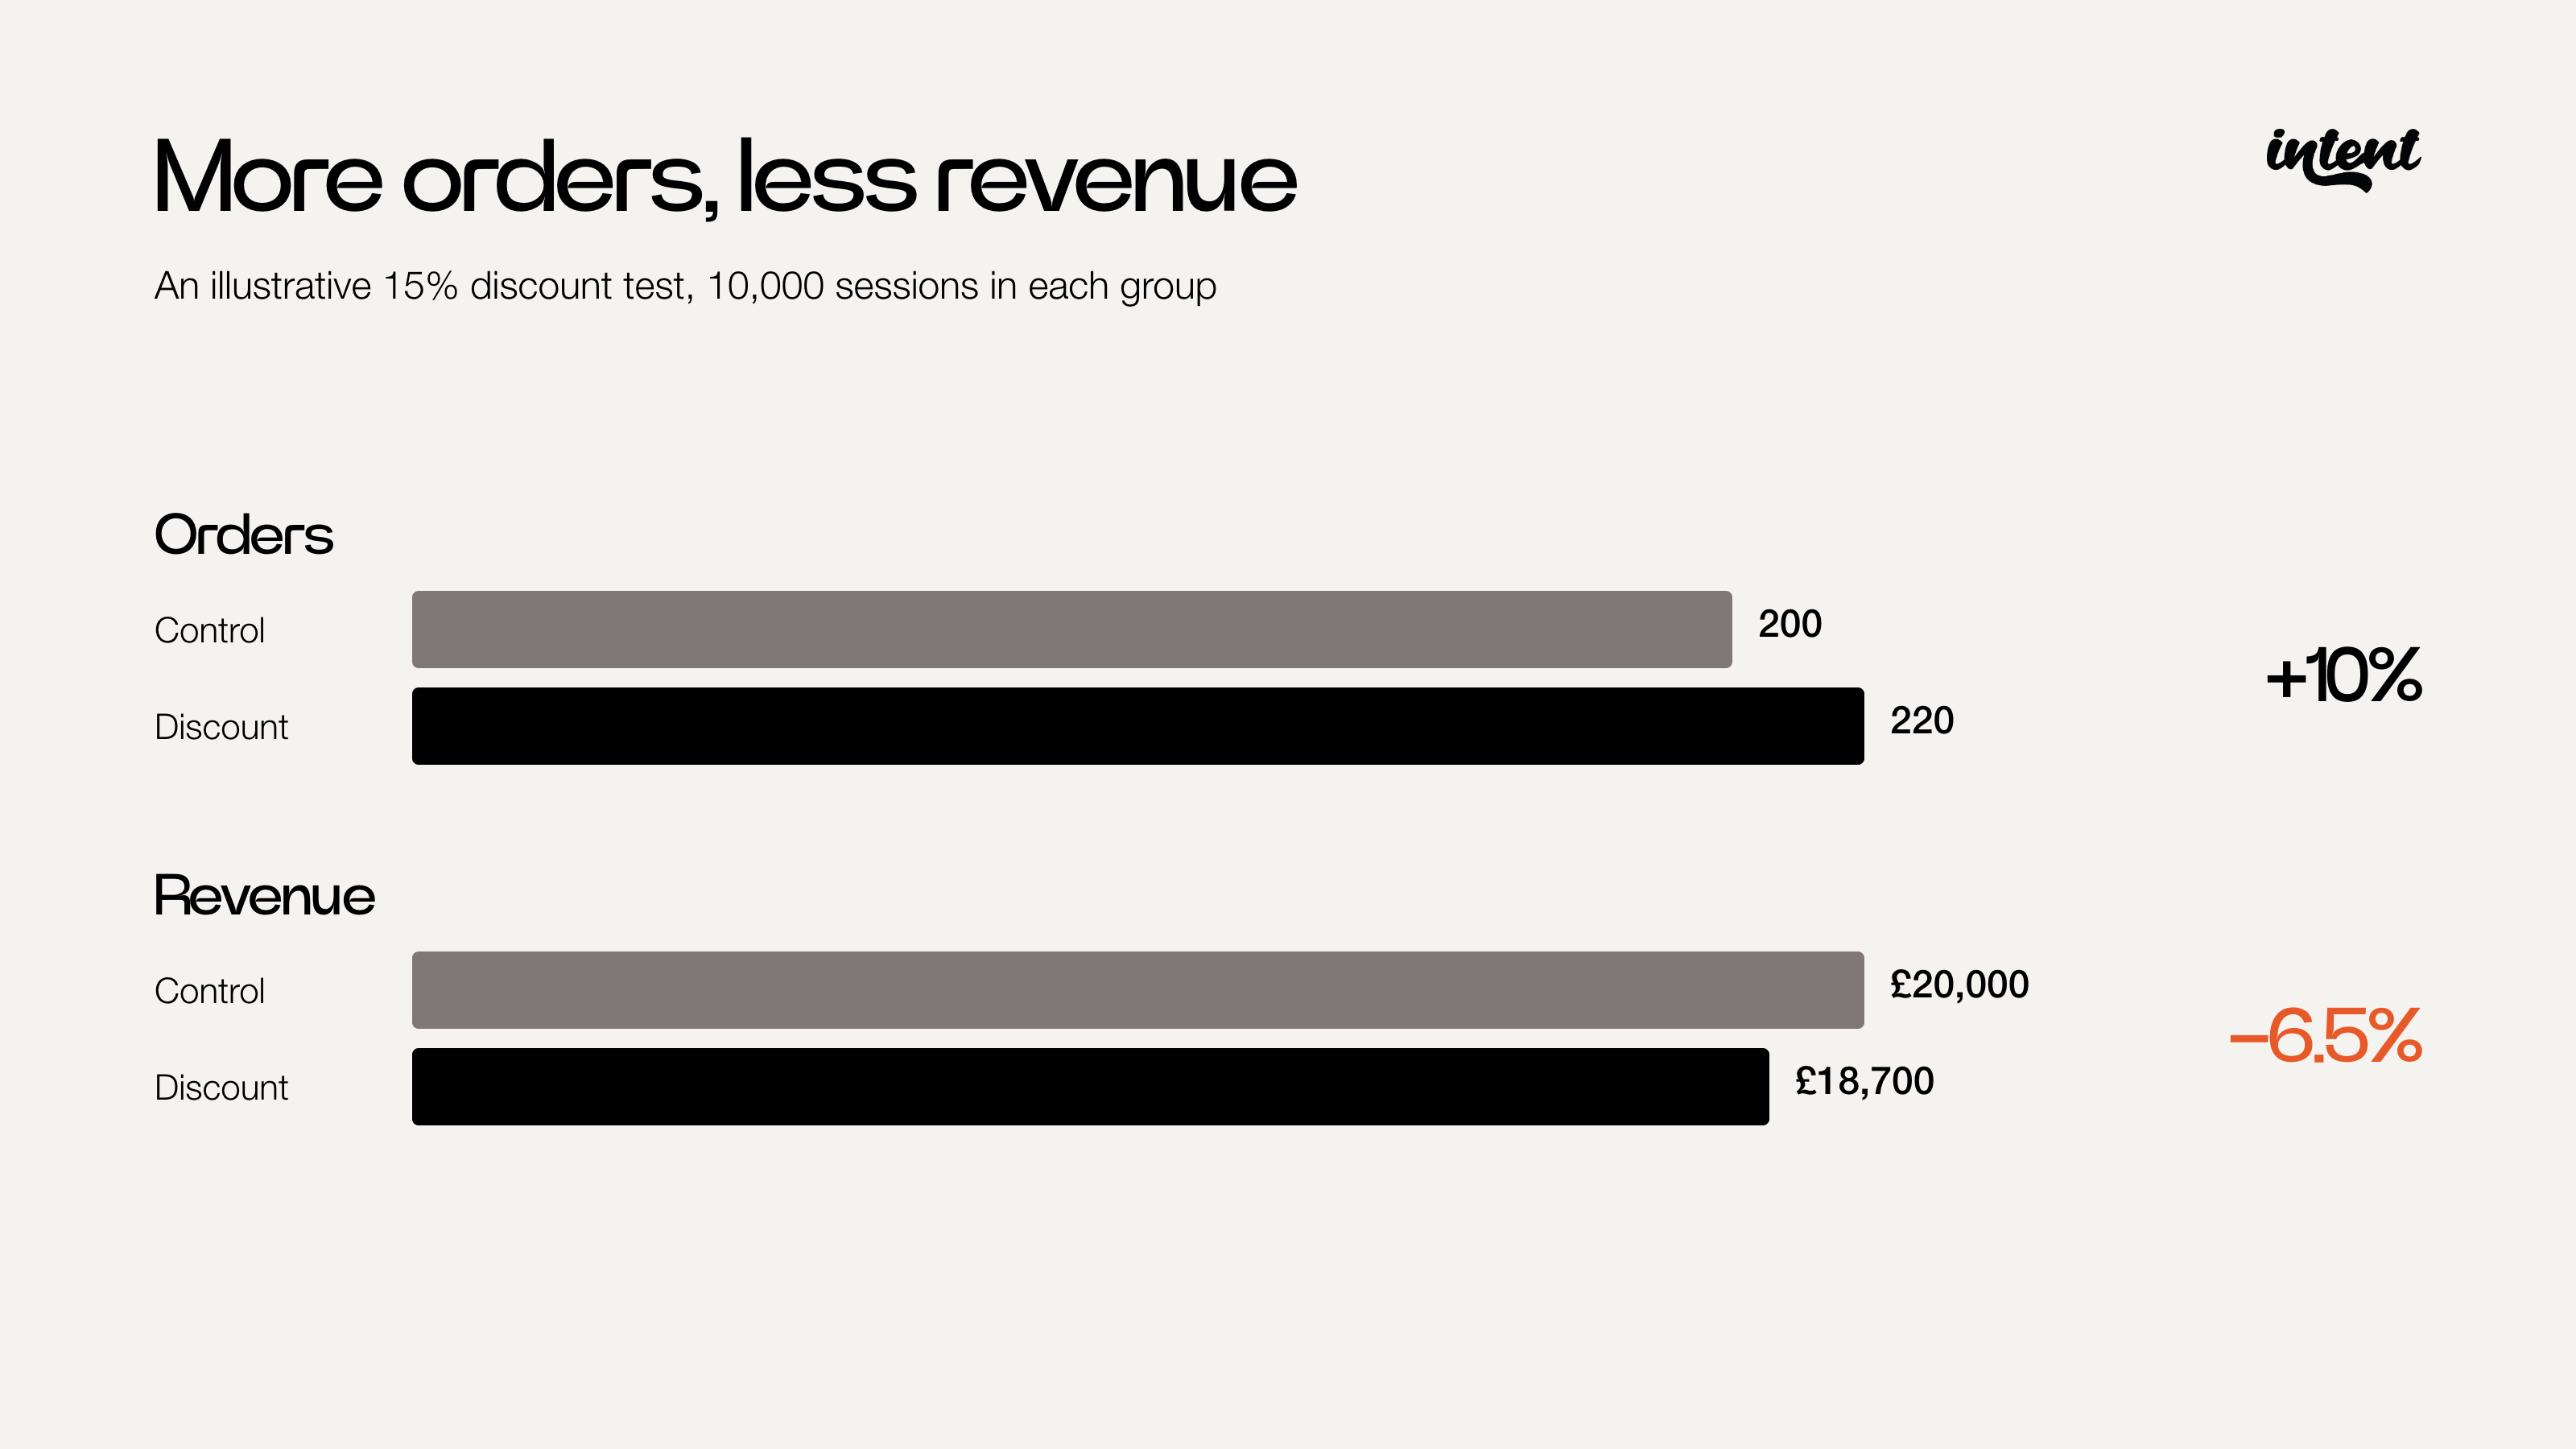
The difference matters when a change increases purchases but reduces what customers spend. Here’s an illustrative discount test:
The discount produces 10% more orders and 6.5% less revenue. A conversion target rewards it. A revenue target challenges it.
RPV makes that trade-off visible, but profitability needs a further check. Discounts, fulfilment costs and returns all affect how much you keep from each order, so track gross profit or contribution per visitor alongside revenue where your data allows.
Before any test starts, agree how you’ll account for discounts and returns, which metric decides success and what margin impact you’re prepared to accept. Leave it until after the result and every team will find the metric that flatters its test.
What is a good ecommerce conversion rate?
A good conversion rate supports your commercial model and improves against a comparable baseline. Market averages help to put it in context. IRP Commerce reported a 1.97% conversion rate for September 2026 across the retailers in its market data, which is a useful reference point for that dataset and month.
For your own business, compare like with like: device, acquisition source, category, customer type and promotional period. If more of your traffic now comes from people discovering the brand, your overall conversion rate can fall even while individual sessions improve.
Keep the buying cycle in view too. For considered purchases that typically span several visits, your evaluation window needs to capture orders placed after the first session.
Revisiting the common CRO tactics
An established programme still needs to find and remove friction. Before prioritising a fix, work out what shows there’s a problem, who experiences it and how much it could be costing you.
Product discovery
When shoppers struggle to find suitable products, inspect search, navigation and filters. Start with zero-result searches, then look for queries that return plausible but unhelpful products, because those failures are harder to spot.
Look at the queries behind poor outcomes. Are shoppers using language your catalogue doesn’t recognise? Are filters hiding available products? Is the problem relevance, stock availability or the range itself?
Shoppers who use search often know what they want, which helps explain why they tend to convert more often than other visitors. To see whether a change to search increases sales, test it against your current search experience.
Product decisions
Product pages need to resolve uncertainty about fit, suitability, quality, delivery and returns. The question is which uncertainty stops shoppers in a particular category.
A sizing question and a delivery concern need different responses. Customer service queries and onsite feedback show you what to investigate. In-session behaviour goes further, showing what each shopper needs while they’re still on the page. Adding content without clear organisation only makes answers harder to find.
Test how you present product information, then measure its effect on revenue. If more shoppers add to their basket, check whether those additions turn into completed orders.
Imagery and reviews do much of that work. Photos and video should show what copy can’t, such as scale, texture and fit. Reviews help most when shoppers can find the ones that answer their own question.
Show delivery costs, timings and returns terms on the product page as well as at checkout. Shoppers who find them early can decide sooner, and those who find them late are more likely to leave.
Checkout
Separate difficulty completing an order from a decision against the purchase. For example, a failed payment and an unacceptable delivery charge both show up as abandonment, but they need different fixes.
Baymard’s checkout research identifies several reasons people leave, from costs and delivery to account requirements and checkout complexity. It also recognises that some shoppers are browsing or aren’t ready to buy. Our own Intent Gap research puts that at 10% of checkout visitors. Fix the avoidable obstacles, and allow for shoppers who use the basket to compare products or plan a later purchase.
Mobile and page speed
Look beneath the device split and break the mobile path into steps to find the source of the problem. For example, do you have a filter that’s hard to use or an overlay covering the next step?
Check how each tool shares the screen with chat windows, consent notices and promotional banners, including when they all appear at once. On a smaller screen, a few well-meaning layers can leave very little shop.
And don't forget about speed. Check how long key pages take to load, and which scripts add to that time. Every tool you add to the page is more for the shopper’s phone to load.
Onsite tactics
Most established programmes already run social proof, urgency messages, offers, email capture, and more. Each can lift conversion on average, and each adds something for the shopper to read, close or wait for. Review them like any other change, including what is the problem each one solves, who it helps and what it costs in margin or shopper attention.
What happens after a test wins?
You’ve researched the problem, tested a change and seen a positive result, so you roll it out. But what happens to that winner six months later, once the promotion has ended, your traffic has changed or you’ve added other messages to the page?
A well-designed A/B test measures the effect of a change under the conditions you tested. As your site and audience change, check whether it still delivers the benefit you saw.
For each change you roll out, keep a short record of why you introduced it, what the test showed and when you’ll review it. Otherwise you’re relying on someone remembering why a banner went live two years ago, and they’ve probably left.
Include removal in those reviews. Test whether taking an old message or offer away improves the experience. Over time, simplifying a crowded page is often worth more than adding yet another tactic.
You can also revisit who sees your winners. If a change worked well overall, test whether showing it selectively beats showing it to everyone. We’ll discuss this more shortly.
Why has your CRO programme plateaued?
You’re still running tests, but the wins are getting smaller and revenue is harder to shift. Before deciding what to try next, look at what’s changed around the site and who sees the tactics you already have.
Are you working on the right problems?
Look through your recent backlog. How many ideas came from customer research, support conversations or evidence of shoppers struggling? And how many were another version of a message or placement you’ve tested before?
Your customers’ questions change as your range, prices and acquisition activity change. If the backlog keeps circling the same ideas, go back to where shoppers get stuck today before commissioning another variant.
What else is affecting performance?
Look at what’s changed around the programme. Are you attracting different visitors? Are popular products out of stock? Have promotions changed? Is tracking working, and did each winning change go live as tested?
An easier checkout will struggle to lift revenue if shoppers can’t buy the products they came for.
Revisit what your tests measured too. If past wins increased clicks or basket additions, check whether those gains carried through to completed orders and revenue.
Who benefits from your existing tactics?
A change can win overall while helping some shoppers, making little difference to others and putting some off. When every winner goes to everyone, those differences cap the value you get from it. We call this the ceiling of the average.
Discounts make it easy to see. An offer might persuade one shopper to buy while giving away margin on an order another shopper would’ve placed at full price. A reassurance message can answer one person’s concern and get in another person’s way.
Those effects get harder to follow as tactics pile up. A review prompt, an email pop-up and an exit offer might each have won its own test, but shoppers now meet them together, sometimes before they’ve seen a product. Test that combined experience rather than adding up the original uplifts.
Start with the offers and messages whose value depends on the shopper’s circumstances. Compare showing them to everyone with showing them selectively, and include the option to leave people alone. If the selective version wins, you’ve found growth in a tactic you already own.
Deciding who should see each intervention
Showing a tactic selectively means deciding which visitors see it, and when.
That, of course, starts with what someone is doing on your site and understanding their behaviour. Two returning mobile visitors can sit in the same segment while one is browsing your product range and the other is close to buying. That's what Intent is all about. Our agent reads shopper behaviour throughout the visit and updates its picture of each visitor as they move around the site.
With Agentic Campaigns, you set the goal and choose the experiences the agent can use, such as existing offers, social proof or reassurance messages. The agent decides what to show each visitor and when, including showing nothing.
For basket abandonment, that means more options than the same discount every time someone looks like they are about to leave. A shopper comparing products might get reassurance, while another carries on without an interruption or a discount they didn’t need. The agent learns which choices improve your target metric.
Leaving someone alone becomes a decision the campaign makes and measures. The platform compares performance with a holdback group, so you can see the additional value the approach creates, including the effect of withholding messages and offers.
Your testing programme keeps developing and validating experiences. Intent decides who gets them, so the tactics you already have can earn more. Optimisation as its best, ay?
Measuring the revenue your programme adds
Conversion rate is easy to game, and a blanket discount is typically the quickest way to do it. Diamonds Factory’s basket abandonment campaign shows what changes when you judge the result on revenue instead.
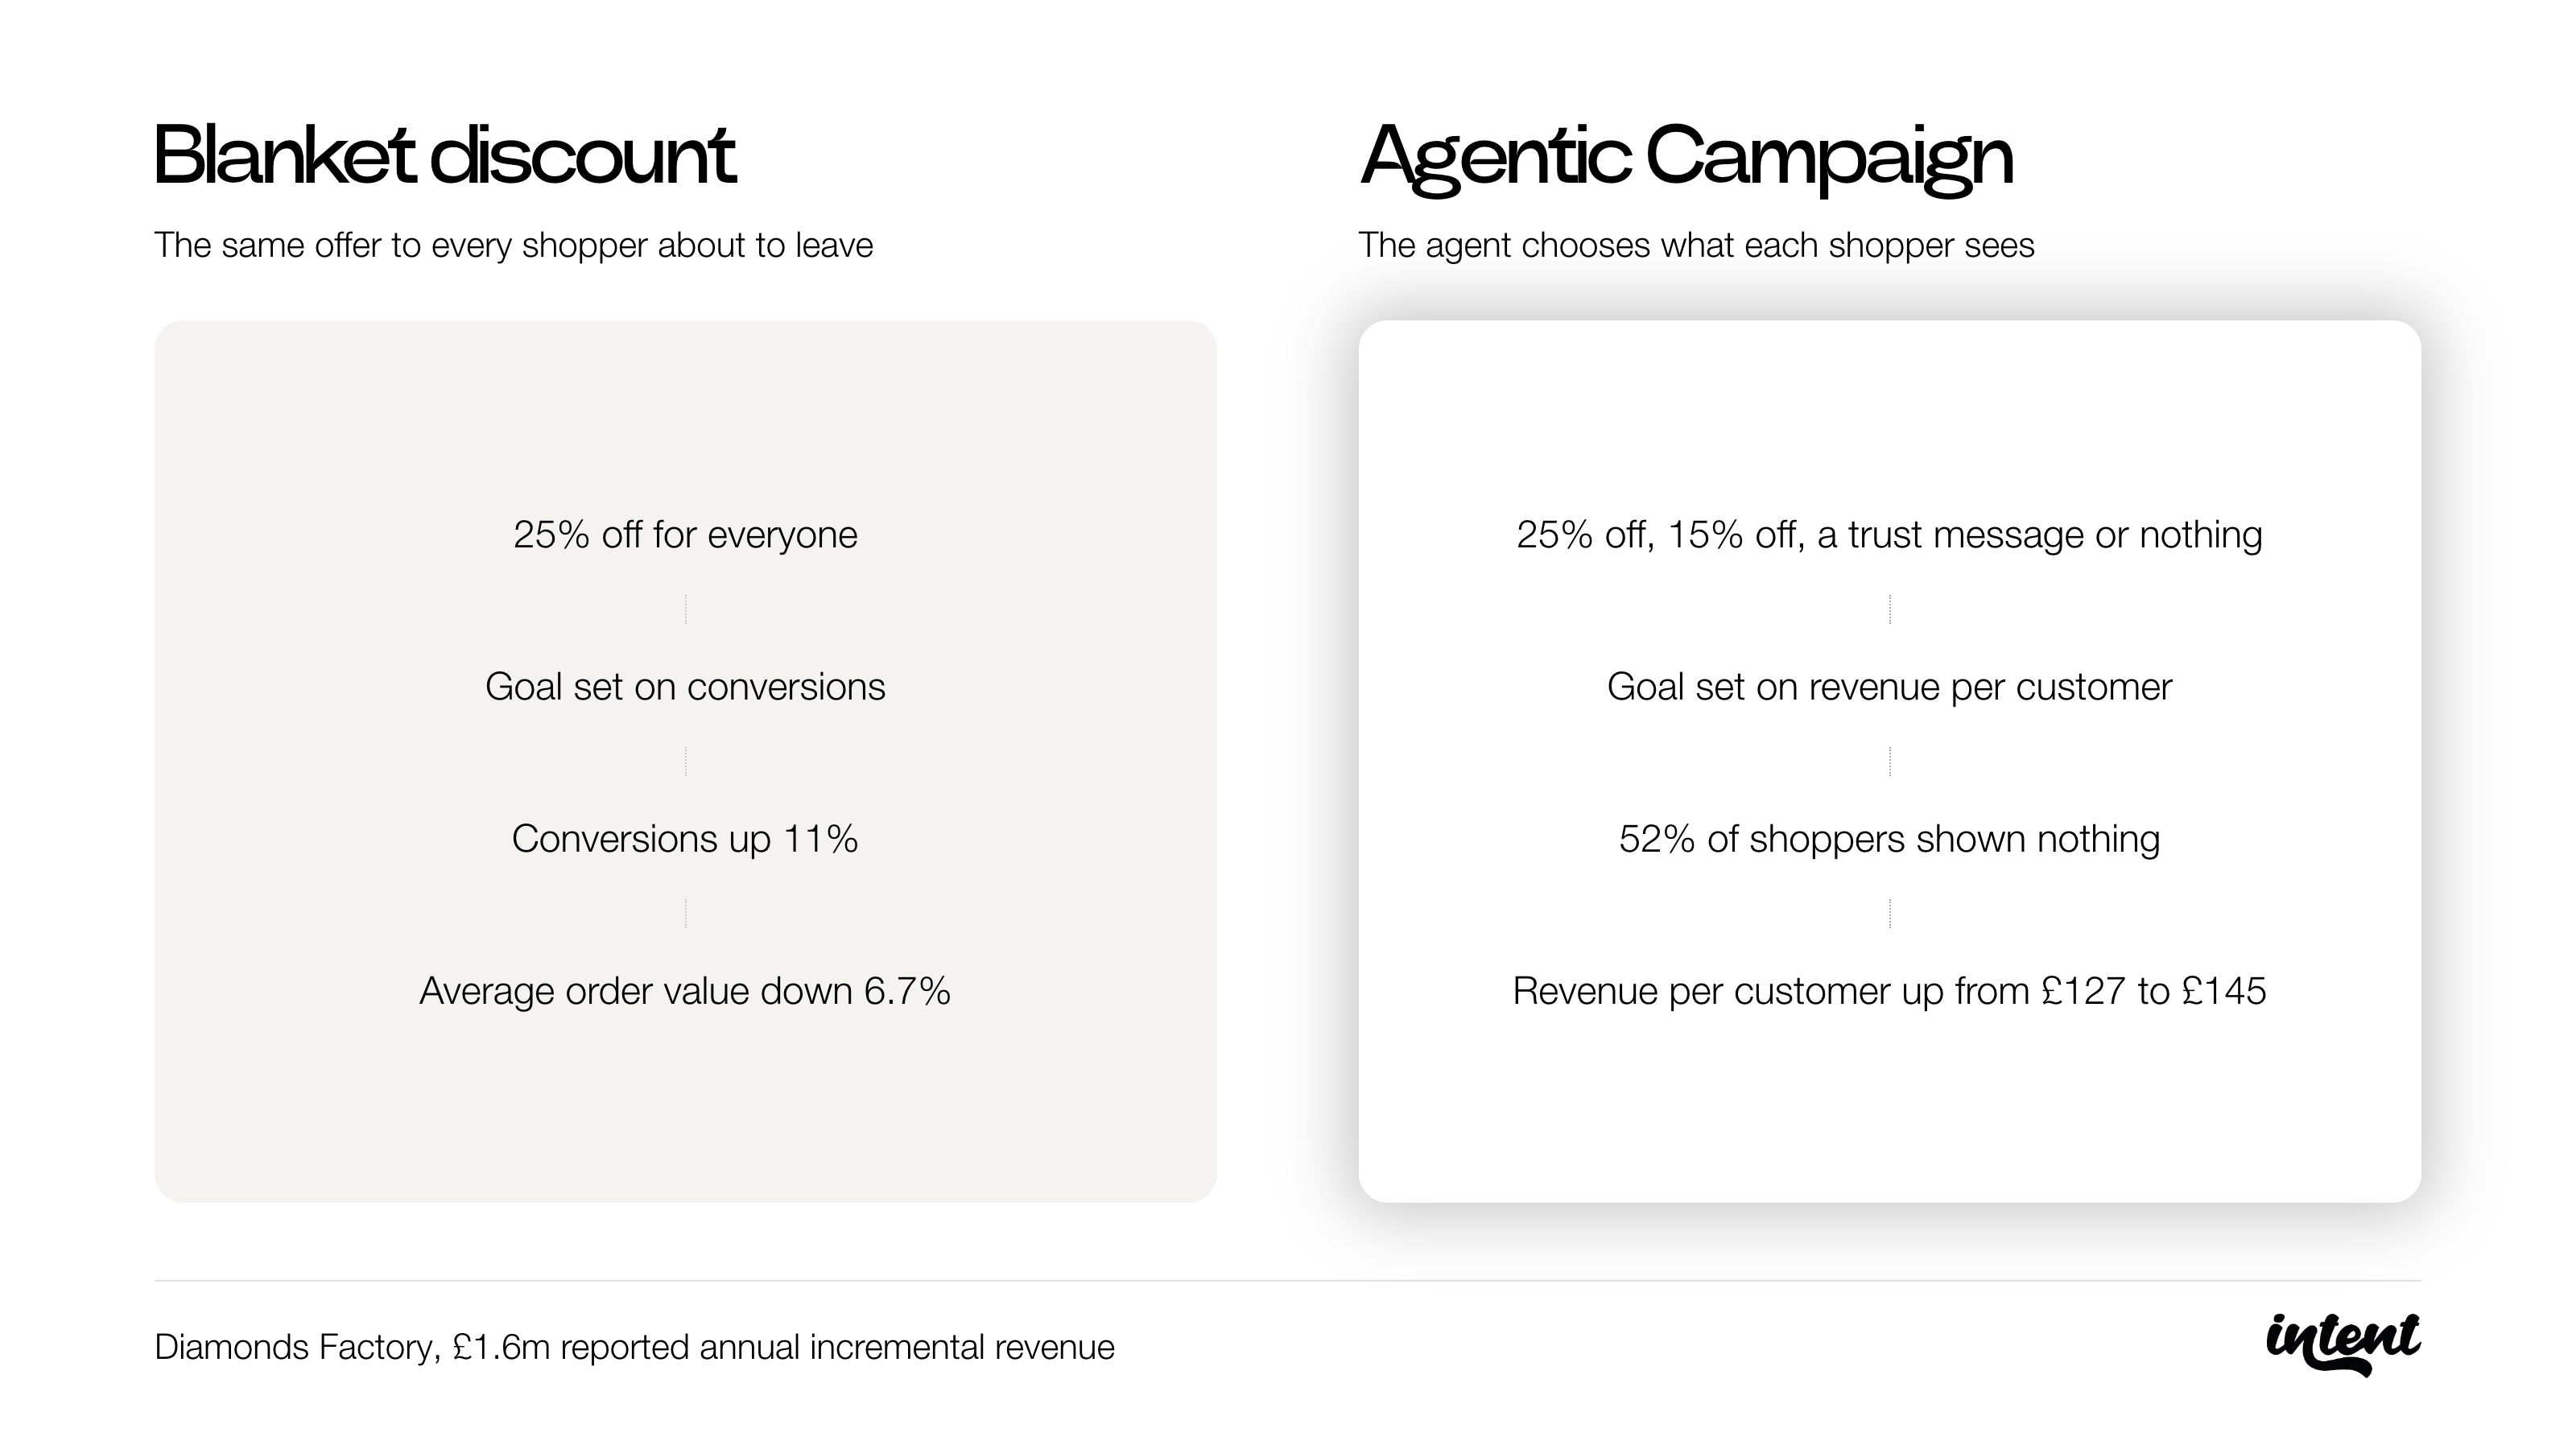
Diamonds Factory is a made-to-order luxury jewellery brand in the Neve Jewels Group. It first offered a blanket 25% discount to shoppers showing signs of abandoning their basket. Conversions rose 11%, while average order value fell 6.7%.
The discount helped, but it went to everyone, including shoppers who would’ve paid full price. So Diamonds Factory ran an Agentic Campaign with four options: 25% off, 15% off, a trust message or no intervention. It also changed the goal from conversions to revenue per customer.
Revenue per customer rose from £127 in the control group to £145 in the Agentic Campaign group, with £1.6m in reported annual incremental revenue. For 52% of customers, the agent chose to show nothing.
Choose a comparison that answers your question
Some shoppers would’ve bought whatever you showed them. Incremental revenue is the extra revenue your change caused, measured against what would’ve happened without it.
Start with what you want to find out. If you already run a blanket offer, comparing it with selective delivery tells you whether targeting improves on your current approach. Comparing selective delivery with no offer tells you whether it adds revenue over leaving shoppers alone. “Better than our existing offer” and “better than no offer” answer different questions, so name the baseline when you share the result.
Before launching, agree who qualifies for the test, how you’ll randomly assign them and how long you’ll allow for a purchase. Use the same revenue definition for both groups. If shoppers return over several visits, keep them in the same group throughout.
Assess everyone assigned to each approach, including shoppers who received no message, because the decision to show nothing is part of what you’re testing. Comparing only people who received an offer with those left alone muddies the result. They were selected for different reasons, and those reasons could explain why one group spent more.
Give the test enough time and traffic
Revenue results fluctuate, especially when a few large orders can shift the average. Ronny Kohavi’s work on online experiments explains why revenue per user can need more data to detect a change reliably.
Work with your experimentation team to plan enough traffic and time to detect an improvement worth acting on. A holdback group gives you a comparison, and you still need enough evidence to judge the difference.
Report the estimated revenue impact, the uncertainty around it and what it means for margin. An inconclusive result leaves the decision open. It doesn’t mean the two approaches perform equally.
Read more about how experimentation and Intent work together.
Where to take your CRO programme next
Start with something you already run, such as a discount that costs margin every time someone uses it. Look back at why it went live. Did the original test show more orders, more revenue or more profit? Has anyone checked whether it still delivers on today’s site?
Use that review to choose your next test. You could, for example, remove the offer, change the response or let Intent decide who sees it. Compare the new approach with what you run today, and agree how you’ll judge revenue and margin before your test starts.
Book a demo to see how Agentic Campaigns decide what to show each visitor, including when to leave them alone.

Become an Intent Insider
Get subscriber-only insights we don't publish anywhere else and event invites before anyone else.
By submitting this form you agree to our (more than fair) terms.